
Mantle Convection and Earth’s Thermal Evolution
My PhD research, supervised by W.R. Peltier at the University of Toronto, involved simulating convection in Earth’s mantle and, in particular, investigating the effects of the endothermic phase transition at 660 km depth in the mantle and its efficacy for producing layered or partially layered convection. I then became interested in in the effect of partial layering on Earth’s surface heat flow which led to an interest in understanding Earth’s thermal history.
I was also briefly a post-doc at the York University in Toronto working with Prof. Garry Jarvis at York University, where we looked at the magnitude of stresses imparted on continents caused by mantle flow.
My former PhD student, Simona Costin, developed a parameterized thermal and magnetic model for Earth’s core that we coupled to the mantle convection model to create a thermal evolution model for Earth. A copy of Simona's thesis can be found here .
|
|
|
|
|
|
|
Here are some old movies of mantle convection in the axisymmetric spherical shell (fig 1) that we used to calculate thermal evolutions. The first has no phase transitions while in the next movie weak phase transitions (fig 2)are acting and in this one earth-like phase transitions (fig 3). There is also a movie with a very strong phase transition effect (fig 4). Note the mantle "avalanches" that are taking place in the last two movies, particularly the last one. |
|
 fig 1
fig 1 fig2
fig2 fig 3
fig 3 fig 4
fig 4Another former PhD student, Gunjan Sinha, used mantle convection models to investigate why the mean mantle temperature gradient might be less than adiabatic and to investigate the combined effects of continents and phase transitions on the planform of mantle convection. A copy of Gunjan's thesis can be obtained here .
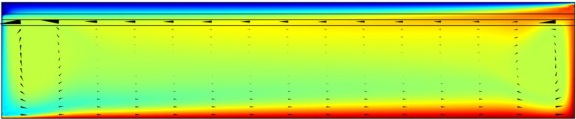
As an undergraduate, Christine Shiels used mantle convection models to study the creation of long wavelength flow in models with stiff mantle plates and a low viscosity asthenosphere. In the image below, the results of a simulation with a surface plate and a low viscosity asthenosphere is shown in an aspect ratio 5 box. Temperatures show color while arrows show velocity. It can be seen that the velocity in the asthenosphere exceeds that in the plate.
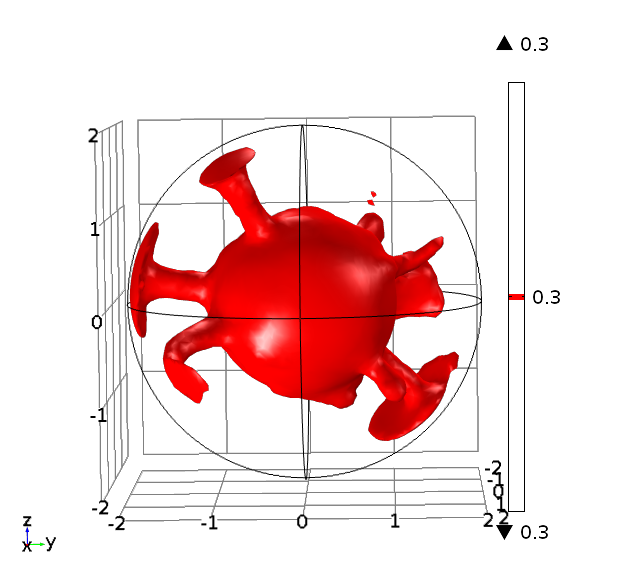
I have recently been using Comsol Multiphysics to carry out some 3D mantle convection simulations in spherical shells. The image below shows a temperature isosurface from one of these simulations.
Post-doctoral fellow Sean Trim worked with me in 2018 and 2019. A paper was published, in collaboration with Julian Lowman, on improving mass conservation in thermo-chemical convection using tracer repositioning.
Papers on Mantle Convection and Earth's Thermal Evolution
- The Impact of Velocity Update and Frequency on Time Accuracy for Mantle Convection Particle Methods, S.J. Trim, S.L. Butler, R.J. Spiteri, Geochemistry, Geophysics, Geosystems, 2024,
- An Exact Solution for 2D Thermochemical Mantle Convection Models, S.J. Trim, S.L. Butler, S.S.C. McAdam, and R.J. Spiteri, Geochemistry, Geophysics and Geosystems, 2023, https://doi.org/10.1029/2022GC010807,
- Benchmarking multiphysics software for mantle convection, Trim S.J., S.L. Butler and R.J. Spiteri, Computers and Geosciences, 154, 2021. https://doi.org/10.1016/j.cageo.2021.104797
- Improving mass conservation with the tracer ratio method: application to thermochemical mantle flows, S.J. Trim, J.P. Lowman and S.L. Butler, Geoscience, Geochemistry and Geophysic, https://doi.org/10.1029/2019GC008799.
- Couette and Poiseuille Flows in a Low Viscosity Asthenosphere: Effects of Internal Heating Rate, Rayleigh Number, and Plate Representation , C Shiels and S.L. Butler, Physics of the Earth and Planetary Interiors, doi:10.1016/j.pepi.2015.07.002, 2015.
- The Effects of Phase Boundary Induced Layering on the Earth's Thermal History , S.L. Butler, DOI: 10.1111/j.1365-246X.2009.04396.x, Geophysical Journal International, 179, 1330-1340, 2009.
- The combined effects of continents and the 660 km depth endothermic phase boundary on the thermal regime in the mantle and here , G. Sinha and S.L. Butler, Physics of the Earth and Planetary Interiors, DOI 10.1016/j.pepi.2009.02.003 Volume: 173 Issue: 3-4 Pages: 354-364 Published: APR 2009
- On the origin and significance of subadiabatic temperature gradients in the mantle or here , G. Sinha and S.L. Butler, Journal of Geophysical Research, VOL. 112, B10406, doi:10.1029/2006JB004850, 2007.
- Modelling the effects of internal heating in the core and lowermost mantle on the earth's magnetic history, S.O. Costin and S.L. Butler, Physics of the Earth and Planetary Interiors, 157, 55-71, 2006
- Numerical models of Earth's thermal history: Effects of inner-core solidification and core potassium , S.L. Butler, W.R. Peltier and S.O. Costin, Physics of the Earth and Planetary Interiors, 152, 22-42, 2005.
- Stresses induced in continental lithospheres by axisymmetric spherical convection, S.L. Butler and G.T. Jarvis, Geophysical Journal International, 157, 1359-1376, 2004.
- The thermal evolution of the earth: models with time dependent layering of mantle convection which satisfy the Urey ratio constraint, S.L. Butler and W.R. Peltier, Journal of Geophysical Research, 107, ESE 3-1, 2002.
- On scaling relations in time dependent mantle convection and the heat transfer constraint on layering , S.L. Butler and W.R. Peltier, Journal of Geophysical Research, 105, Feb. 2000.
- Scale invariance and the avalanche effect in mantle mixing, S.L. Butler and W.R. Peltier, in Scale Invariance and Beyond, Springer, pp. 147-157, 1998.
- Internal thermal boundary layer stability in phase transition modulated convection, Samuel Butler and W.R. Peltier, Journal of Geophysical Research, 102, Feb,1997.
- The influence of phase transitions on mantle mixing and plate tectonics, W.R. Peltier, S. Butler and L.P. Solheim, in The Earth's Deep Interior, Gordon and Breach, pp. 405-430, 1995.
Flows in Porous Media
In 2002, I spent some time at Cambridge University working at the Institute for Theoretical Geophysics with Herbert Huppert and Grae Worster on modeling mushy layers. Mushy layers are porous media where solidification and melting can take place. A great deal of interesting dynamical behaviour can occur because of the change in density that can occur because of solidification and melting and because of the effects on permeability.
 |
| A porous layer melting due to heating from above. The colours show the porosity and the top layer becomes completely molten. |
An interesting issue in porous media is that a dissolved solute and heat both advect and diffuse at very different rates. This can lead to interesting behaviour if a liquid with a different solute concentration and temperature is injected into a porous layer. Julia Milne, a summer student, and I carried out a number of simulations to better understand this problem. Take a look at some simulationsthat Julia made in the summer of 2003.
In a mushy layer, the composition and thermal fields are coupled by the liquidus condition and so the effective advection and diffusion rates will be affected. In one research project, I calculated these, as well as transport induced melting rates in a mushy layer.
In 2007, I took a sabbatical leave to Brown University in Providence Rhode Island where I became interested in issues related to compaction in porous layers. Theory and experiments have shown that if the viscosity of the solid matrix decreases with porosity, that if the matrix is strained, the matrix will spontaneously separate into regions of high and low porosity. When buoyancy is also present, porosity waves can also occur. I created a numerical model to investigate the combined effects of these two phenomena and showed that porosity localization still occurs in bands, but there may be more than one set of porosity bands.
|
|
|
|
| (fig 4) a movie of a compacting porous layer undergoing pure shear with horizontal compression and buoyancy where the viscosity depends only on porosity. (fig 5) is a movie of the same thing with vertical compression. Note the change in the oscillations because of the different orientation of the bands relative to gravity. (fig 6) is a model with vertical compression and gravity where the viscosity of the matrix depends on the strain-rate of the matrix as well. Notice how there are now two sets of bands at roughly 20 degrees to vertical. | ||
 fig 5
fig 5 fig 6
fig 6The deformation of partially molten samples also results in anisotropic arrangement of melt pockets at the grain scale. It has been proposed that this arrangement may cause the matrix to have an anisotropic viscosity. I have carried out simulations of melt bands with anisotropic viscosity and these can lead to low angle bands.
Current graduate student, David Gebhardt, is working on modeling melt bands where the corner flow of a mid-ocean ridge is used as the background flow. The aim is to evaluate how effective melt bands might be for channeling melt towards mid-ocean ridges.
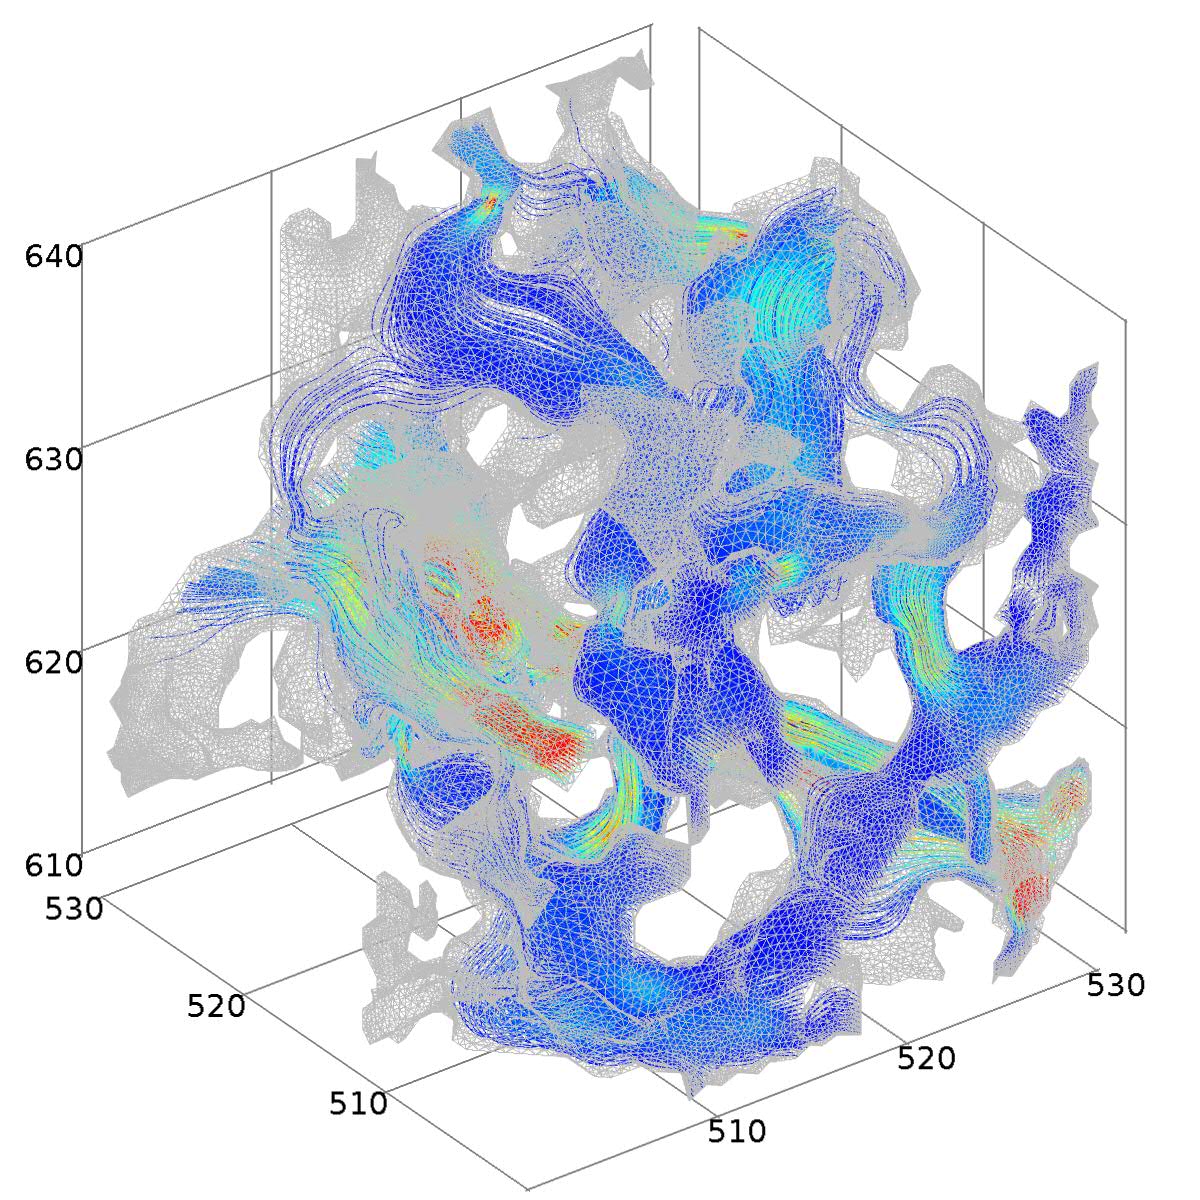
For his MSc research, Michael Bird imported synchrotron X-ray tomography derived images into Comsol and created meshes of the pore-space. He then solved the Navier-Stokes equations for fluid flow and Laplace's equation for electrical conduction in order to calculate the permeability and the electrical formation factor. An image of the streamlines, color coded with the magnitude of the velocity is shown in the image below.
Here is a link to a lecture that I gave as part of a Melt in Earth's Mantle workshop at the Isaac Newton Institute at Cambridge University.
Papers on Flows in Porous Media
- Pore-scale mushy layer modelling, F. Amiri and S.L. Butler, Journal of Fluid Mechanics, 2024, 983:A30, doi:10.1017/jfm.2024.150.
- Effects of ongoing melting and buoyancy on melt band evolution in a compacting porous layer, Physics of the Earth and Planetary Interiors, 2020, 304, https://www.sciencedirect.com/science/article/pii/S0031920119303589.
- Shear-induced porosity bands in a compacting porous medium with damage rheology, S.L. Butler, Physics of the Earth and Planetary Interiors, 2017, 264, 7-17, http://dx.doi.org/10.1016/j.pepi.2016.12.006.
- Linear analysis of melt band formation in a mid-ocean ridge corner flow, Geophysical Research Letters, D.J. Gebhardt and S.L. Butler, DOI: 10.1002/2016GL068688, 43, 2016.
- Numerical modeling of fluid and electrical currents through geometries based on synchrotron X-ray tomographic images of reservoir rocks using Avizo and COMSOL ,M.B. Bird, S.L. Butler, C.D. Hawkes,T. Kotzer, vol. 73, 6-16, Computers and Geosciences, 2014.
- Numerical Models of Shear-Induced Melt Band Formation with Anisotropic Matrix Viscosity, S. L. Butler, vol. 200-201, 28-36, Physics of the Earth and Planetary Interiors, 2012, DOI: http://dx.doi.org/10.1016/j.pepi.2012.03.011, here for a local version .
- Geochemical assessment of isolation performance during 10 years of CO2 EOR at Weyburn, Johson et al., Energy Procedia, vol 4, 3668-3666, 2011.
- Effective transport rates and transport-induced melting and solidification in mushy layers, S.L. Butler, doi:10.1063/1.3541840, Physics of Fluids, volume 23, article 016602 2011.
- Porosity Localizing Instability in a Compacting Porous Layer in a Pure Shear Flow and the Evolution of Porosity Band Wavelength , S.L. Butler, doi:10.1016/j.pepi.2010.06.004, Volume 182, Issues 1-2, September 2010, Pages 30-41, Physics of the Earth and Planetary Interiors link here for a local version.
- The effects of buoyancy on shear-induced melt bands in a compacting porous medium and here , S.L. Butler, Physics of the Earth and Planetary Interiors, DOI 10.1016/j.pepi.2008.10.022. Volume: 173 Issue: 1-2 Pages: 51-59 Published: MAR 2009
- Channels and melting in deformable porous media, S.L. Butler, Published in the preceedings of the COMSOL, Boston, 2007 conference.
- A numerical investigation of the effects of compositional and thermal buoyancy on transient plumes in a porous layer, J.E. Milne and S.L. Butler, Journal of Porous Media, Volume 10, Issue 2, 2007.
- Numerical modelling of convection in a reactive porous medium with a mobile mush-liquid interface, S.L. Butler, H.E. Huppert and M.G. Worster, Journal of Fluid Mechanics, 549, 99-129, 2006.
Tektites
Splashform tektites are glassy rocks that were created from the splash of molten rock that occurred after certain large Earth impacts.
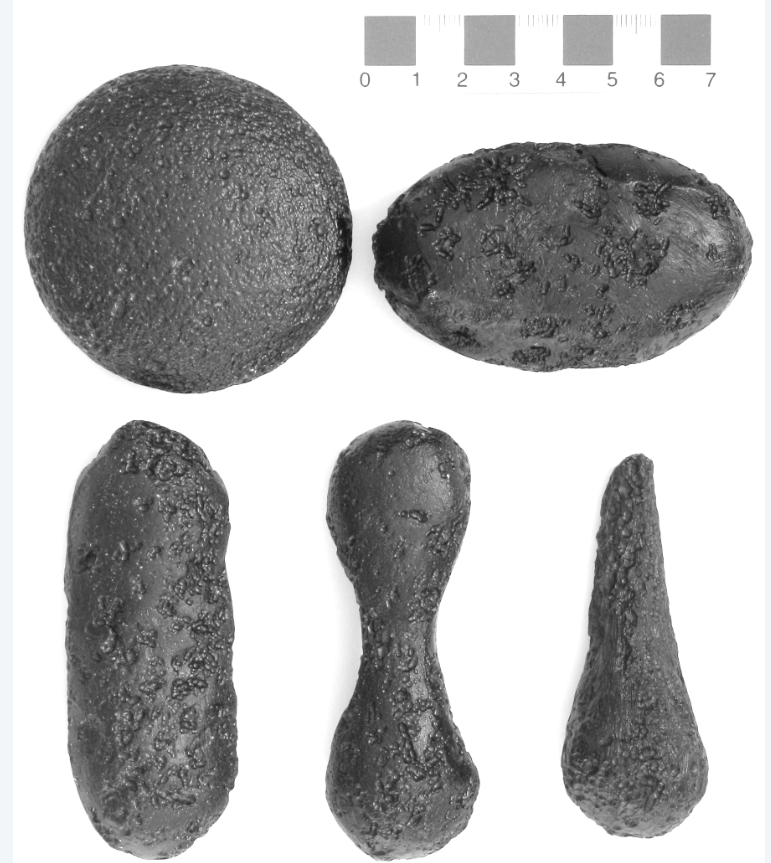
Splashform tektites are found in a number of interesting shapes including near spheres, disks and dumbbells. The shapes of tektites are thought to arise from an interaction of centrifugal and surface tension forces on rotating molten drops. My colleague, Mel Stauffer , has compiled data on the dimensions of thousands of tektites from southeast Asia while my colleague, Ray Spiteri , and I have created a model of rotating liquid drops with surface tension. We have shown that the time evolution of this model agrees well with the shape distribution of real splash-form tektites.
 |
| A movie from one of our simulations of a drop going from a near sphere to a flattened ellipsoid to a dumbbell can be seen here. |
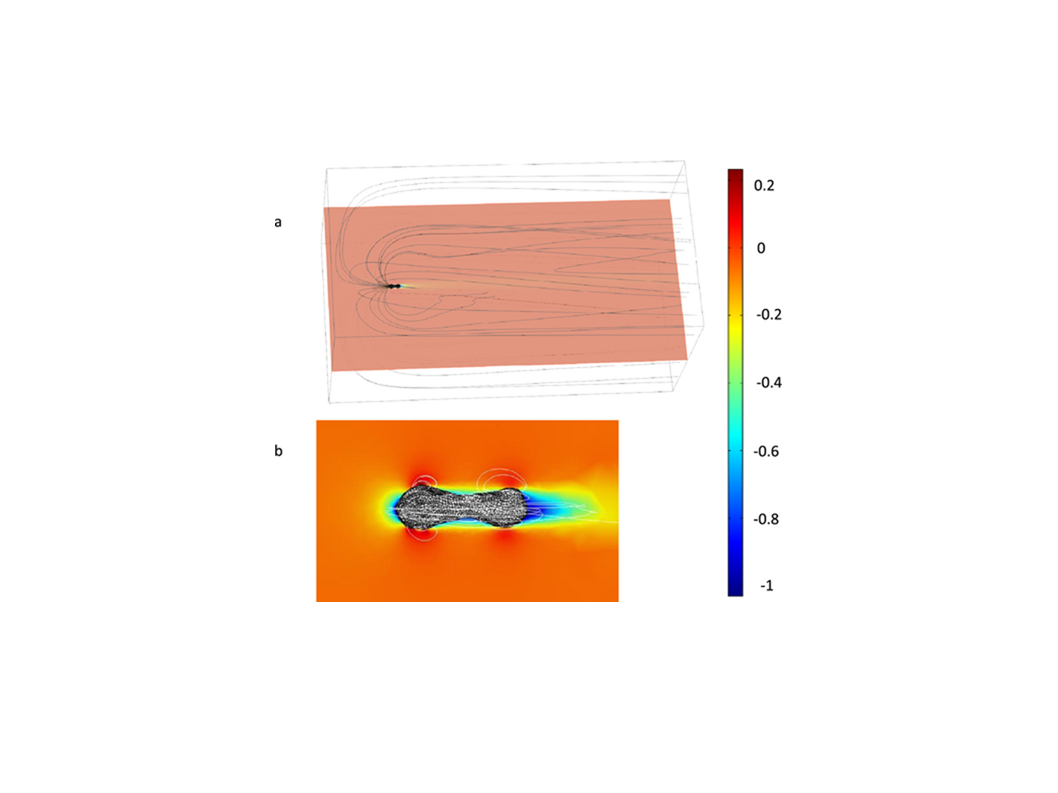
Claire Samson's group at Carleton University has imaged tektites using a laser scanning camera. These images allow us to calculate the volume and moment of inertia of tektites which allows us to calculate their density and constrain their rotation rates. We have also used the resulting image in Comsol to flow air over the tektites in order to calculate their drag coefficients which help us to determine whether aerodynamic effects are important in shaping tektites. The image below shows the streamlines and magnitude of velocity (colors) from a simulation of a tektite moving to the left through air.
 I have also provided numerical model results for comparison laboratory-produced synthetic tektites. Here is a link to a recent physicsworld article regarding artificial tektites.
Papers on Splashform Tektites
- Self-sustained deformable rotating liquid He cylinders: The pure normal fluid 3He and superfluid 4He cases, M. Pi, F. Ancilotto, M. Barranco, S.L. Butler, and J. M. Escartin, Phys. Rev. B., 108, 054524, 2023 or here for a local version.
- Equilibrium shapes of two and three dimensional two-phase rotating fluid drops with surface tension: effects of inner drop displacement, S.L. Butler, Physics of Fluids, 34, 2022, https://doi.org/10.1063/5.0121208 or here Equilibrium shapes of two and three dimensional two-phase rotating fluid drops with surface tension: effects of inner drop displacement (usask.ca)
- Equilibrium shapes of two-phase rotating fluid drops with surface tension, S.L. Butler, Physics of Fluids,32, https://doi.org/10.1063/1.5134458.
- Shapes of rotating superfluid helium nanodroplets, C. Bernando et al., Physics Review B, 2017, 95, 064510.
- Artificial tektites: an experimental technique for capturing the shapes of spinning drops, Kyle A. Baldwin, S.L. Butler, Richard J. A. Hill, vol. 5, 7660, Scientific Reports, doi:10.1038/srep07660, 2015.
- 3-D laser images of splash-form tektites and their use in aerodynamic numerical simulations of tektite formation ,C. Samson, S. Butler, C. Fry, P.J.A. McCausland, R.K. Herd, O. Sharomi, R.J. Spiteri and M. Ralchenko, vol. 49, 740-749, Meteoritics and Planetary Science, 2014.
- The shape distribution of splash-form tektites predicted by numerical simulations of rotating fluid drops, S. L. Butler, M. R. Stauffer, G. Sinha, A. Lilly and R. J. Spiteri, DOI: 10.1017/S0022112010005641, Journal of Fluid Mechanics, volume 667, 358-368, article 016602, 2011.
- The Shapes of Splash-Form Tektites: Their Geometrical Analysis, Classification and Mechanics of Formation , M.R. Stauffer and S.L. Butler, 10.1007/s11038-010-9359-y, Earth Moon and Planets, Volume 107, Issue 2 (2010), Page 169.
Applied Geophysical Techniques
I have also spent some time delving into the theory of the resistivity method. As a result of an enquiry from a former student, we have looked into the effects of an leakage current or of an unintentional additional potential electrode.
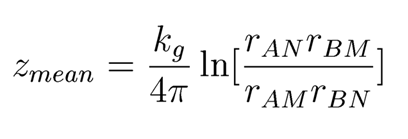
It has long been held that there is no simple, general, formula to estimate the depth of investigation for the resistivity method that takes into account the positions of all four electrodes. I have found that if you consider the mean of the sensitivity function of the resistivity method for a homogeneous infinite half space, that it does have a simple formula which is shown below. Here, kg is the geometrical factor and rAN is the distance from the A electrode to the N electrode. The other distances are defined similarly. This estimate works for all array types except a pole-pole.
Papers on Applied Geophysics
- Analytical Expressions for the Depth Investigation Characteristic and Mean Sensitivity Depth for Electrical Resistivity Surveys Using Long Electrodes - Butler - 2026 - Geophysical Prospecting - Wiley Online Library
-
On signal contribution functions and sensitivity for frequency-domain electromagnetic and direct current electrical resistivity methods. S.L. Butler, 2025, Geophysical Prospecting, 1–15. https://doi.org/10.1111/1365-2478.70011
-
Spontaneous Potential Measurements in Surface Fresh Waters for Engineering and Environmental Applications, S. L. Butler; Geophysical Journal International, 2025;242 (3), ggaf278, https://doi.org/10.1093/gji/ggaf278.
- Detection of a Permeable Aquifer Geohazard Above Potash Mines using In-mine Time-domain Electromagnetics.Todd J. LeBlancSamuel L. Butler; Journal of Environmental and Engineering Geophysics 2025;; 29 (4): 127–141. doi: https://doi-org.cyber.usask.ca/10.32389/JEEG23-014
- Analytical formulas for geometrical factor and sensitivity for long electrodes, S.L. Butler, Geophysical Prospecting, 2024, DOI: 10.1111/1365-2478.13644.
- Non-convectional arrays for self-potential surveys, Souza de Araujo, Oziel et al., Geophysical Journal International, 2024, 1833-1847, https://doi.org/10.1093/gji/ggae348.
- Reliable linear transformation of pseudo-pole-pole electrical resistivity datasets, Yun You and S.L. Butler, Journal of Applied Geophysics, 227, https://doi.org/10.1016/j.jappgeo.2024.105420.
- Simple formulas for pseudoposition for electrical resistivity and IP in vertical boreholes based on mean positions of the sensitivity, S.L. Butler, Geophysical Prospecting, https://doi.org/10.1111/1365-2478.13170.
- Forward modeling of magnetotellurics using Comsol Multiphysics, Li, A., and S.L. Butler, Applied Computing in Geosciences, 12, 2021. (Open Source) https://doi.org/10.1016/j.acags.2021.100073
- On the determinability of all of the self- and mutual resistances in a grounded electrode array, S.L. Butler, Prospecting Geophysics, doi: 10.1111/1365-2478.12786, 2019.
- Analysis of the moments of the sensitivity function for resistivity over a homogeneous half-space: rules of thumb for pseudoposition, offline sensitivity and resolution, S.L. Butler, Journal of Applied Geophysics, https://doi.org/10.1016/j.jappgeo.2017.06.005, 2017.
- A simple method of image solution for a sphere of constant electrical potential in a conducting half-space: implications for the applied potential method, S.L. Butler, Geophysical Prospecting, DOI: 10.1111/1365-2478.12506, 2017.
- The mean sensitivity depth of the electrical resistivity method, , S.L. Butler, Geophysical Prospecting, DOI: 10.1111/1365-2478.12354, 2016. here for a local version
- Forward modeling of geophysical electromagnetic methods using Comsol, , S.L. Butler, Z. Zhang, Computers and Geosciences, doi:10.1016/j.cageo.2015.11.004, 2015. here for a local version
- An analysis of errors caused by leakage currents and unintentional potential groundings in the electrical resistivity method , S.L. Butler, L. Pitka and R.J. Spiteri, Journal of Applied Geophysics, Volume 114, March 2015, Pages 251–258, doi:10.1016/j.jappgeo.2015.01.016, 2015.
- Forward modeling of applied geophysics methods using Comsol and comparison with analytical and laboratory analog models, S. L. Butler and G. Sinha, Computers and Geosciences, vol. 42, 168-176, 2012.Link here for a local version.
Click here for Comsol files in support of our 2015 Computers and Geosciences paper "Forward Modeling of Geophysical Electromagnetic Methods Using Comsol"