USask Atmospheric Instrument Flies on CNES First Transatlantic Balloon Mission
A team from the University of Saskatchewan (USask) successfully demonstrated OSIRIS-3, a newly designed and built atmospheric remote-sensing instrument, during the first transatlantic stratospheric balloon flight conducted by the French space agency CNES. Launched from Esrange Space Center in Kiruna, Sweden in June 2024, the balloon carried OSIRIS-3 and other payloads across the Atlantic Ocean before landing on Baffin Island, Nunavut.

The original Canadian OSIRIS (Optical Spectrograph and InfraRed Imaging System) instrument aboard the Swedish Odin satellite has provided global ozone, nitrogen dioxide, and aerosol measurements for over 25 years since its launch to low earth orbit in 2001. OSIRIS-3 is a prototype successor to this long-running instrument and uses the proven limb-scattering measurement technique with a smaller optical payload volume. Flying OSIRIS-3 as a cubesat enables affordable climate monitoring measurements like those from the aging OSIRIS instrument to continue.
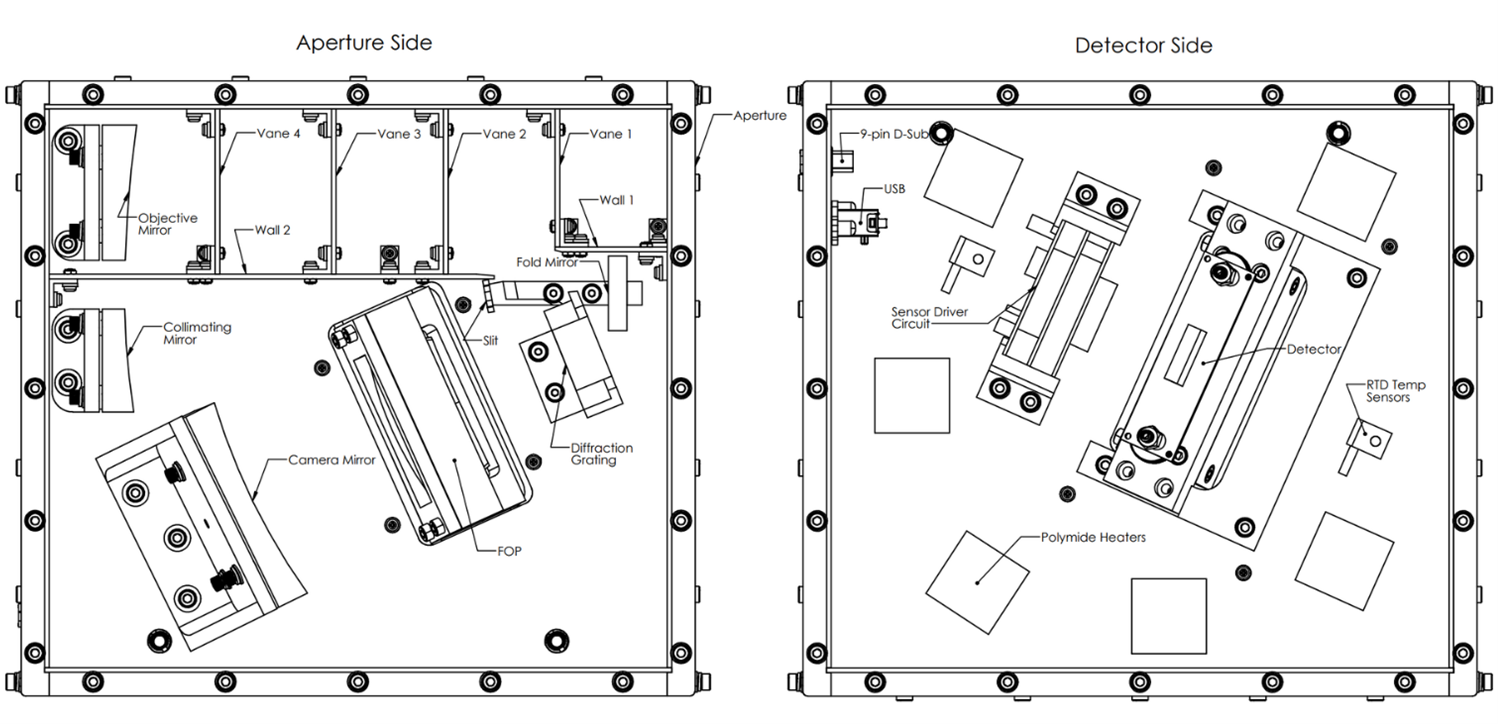
Designed and built at USask, OSIRIS-3’s optical unit features a compact optical layout built to withstand the thermal cycling and low pressure environment of a cubesat flight or a stratospheric balloon flight. The design uses an off-axis telescope and slit assembly that defines the instrument field of view while minimizing stray-light contamination. As in the OSIRIS design, the cubesat optical design also utilizes a grating and custom field-flattening optics. The figure below show the layout of the optical unit.
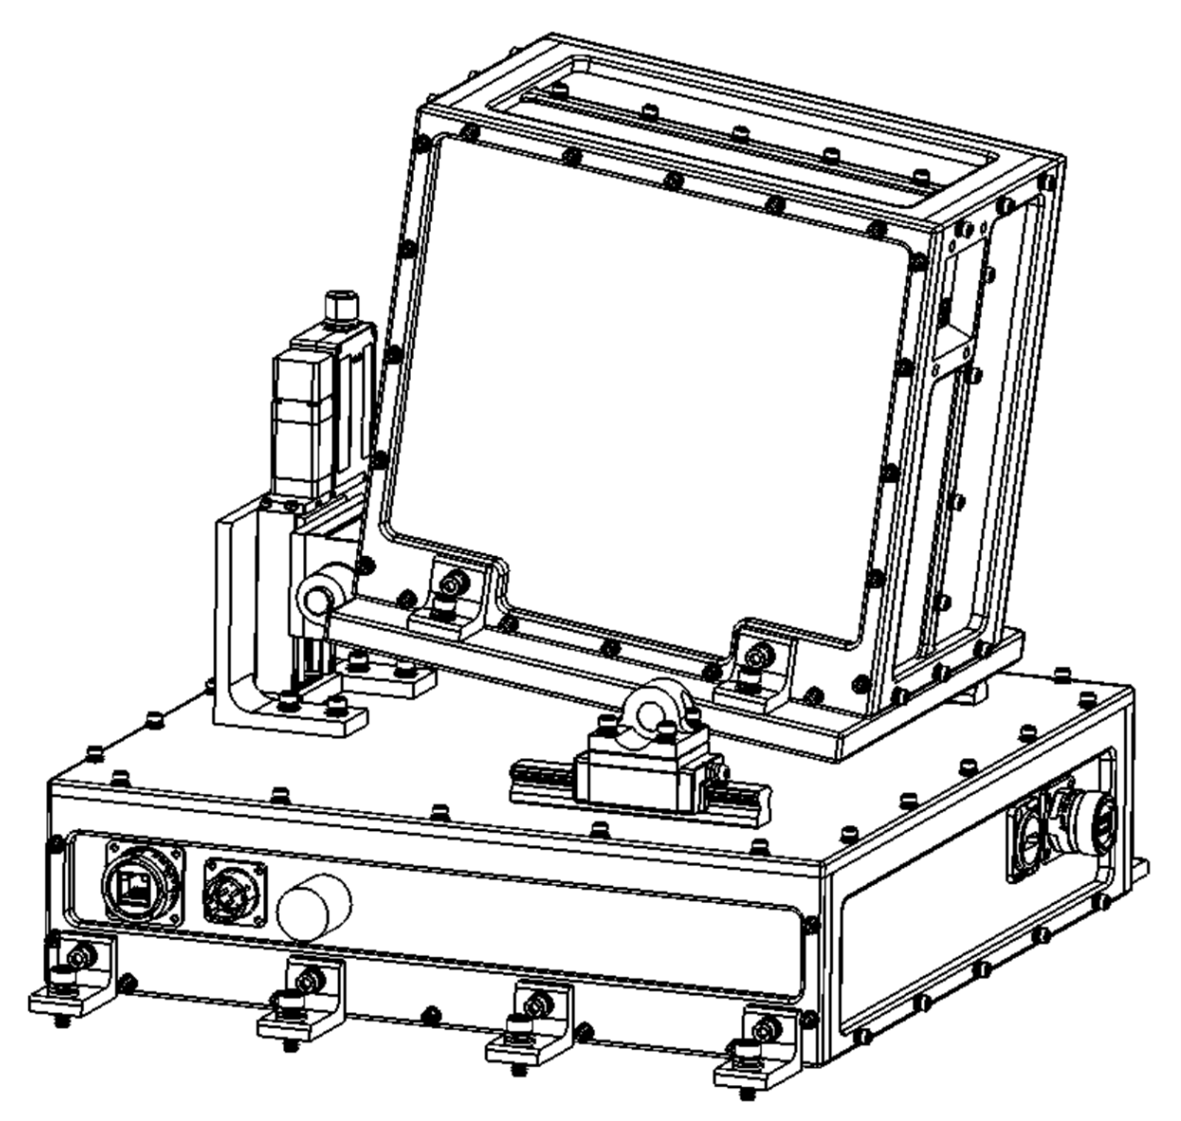
The figure above shows the mounting of the unit on a zenith scan mechanism used for the balloon flight. The instrument enclosure, flight software, electronics hardware, and thermal controls designed and built by the USask team are specific to the balloon environment for this prototype. For deployment as a cubesat instrument, the mass and power could be reduced with margin depending on the bus provider. An estimated mass of the cubesat optical assembly is 2 kg. And an estimate of the power requirement for the cubesat instrument is between 15 and 20 Watts.
The TRANSAT 2024 campaign provided a unique opportunity to test OSIRIS-3 in a near-space environment. The mission was a success as the balloon platform allowed the USask built instrument to perform stable limb viewing scans of the atmosphere at an operating altitude of over 30 km for nearly four days.
The OSIRIS-3 project is led by Dr. Adam Bourassa (PI) with Dr. Doug Degenstein as Co-Investigator. USask students Colin Dyck and Isaac Nichols played significant roles in design, optical bench testing and calibration, pre-flight testing, and campaign operations. The project was also supported by other Atmospheric Research Group members including Alexis Bourassa, Nick Lloyd, and Paul Loewen. Funding was provided by the Government of Canada Flights and Fieldwork for the Advancement of Science and Technology (FAST) 2021 program.
With a successful transatlantic demonstration now complete, OSIRIS-3 is positioned to advance toward an eventual cubesat deployment, ensuring continued Canadian leadership in stratospheric measurements of key climate species.
New results from OSIRIS: upper-stratospheric temperature trends
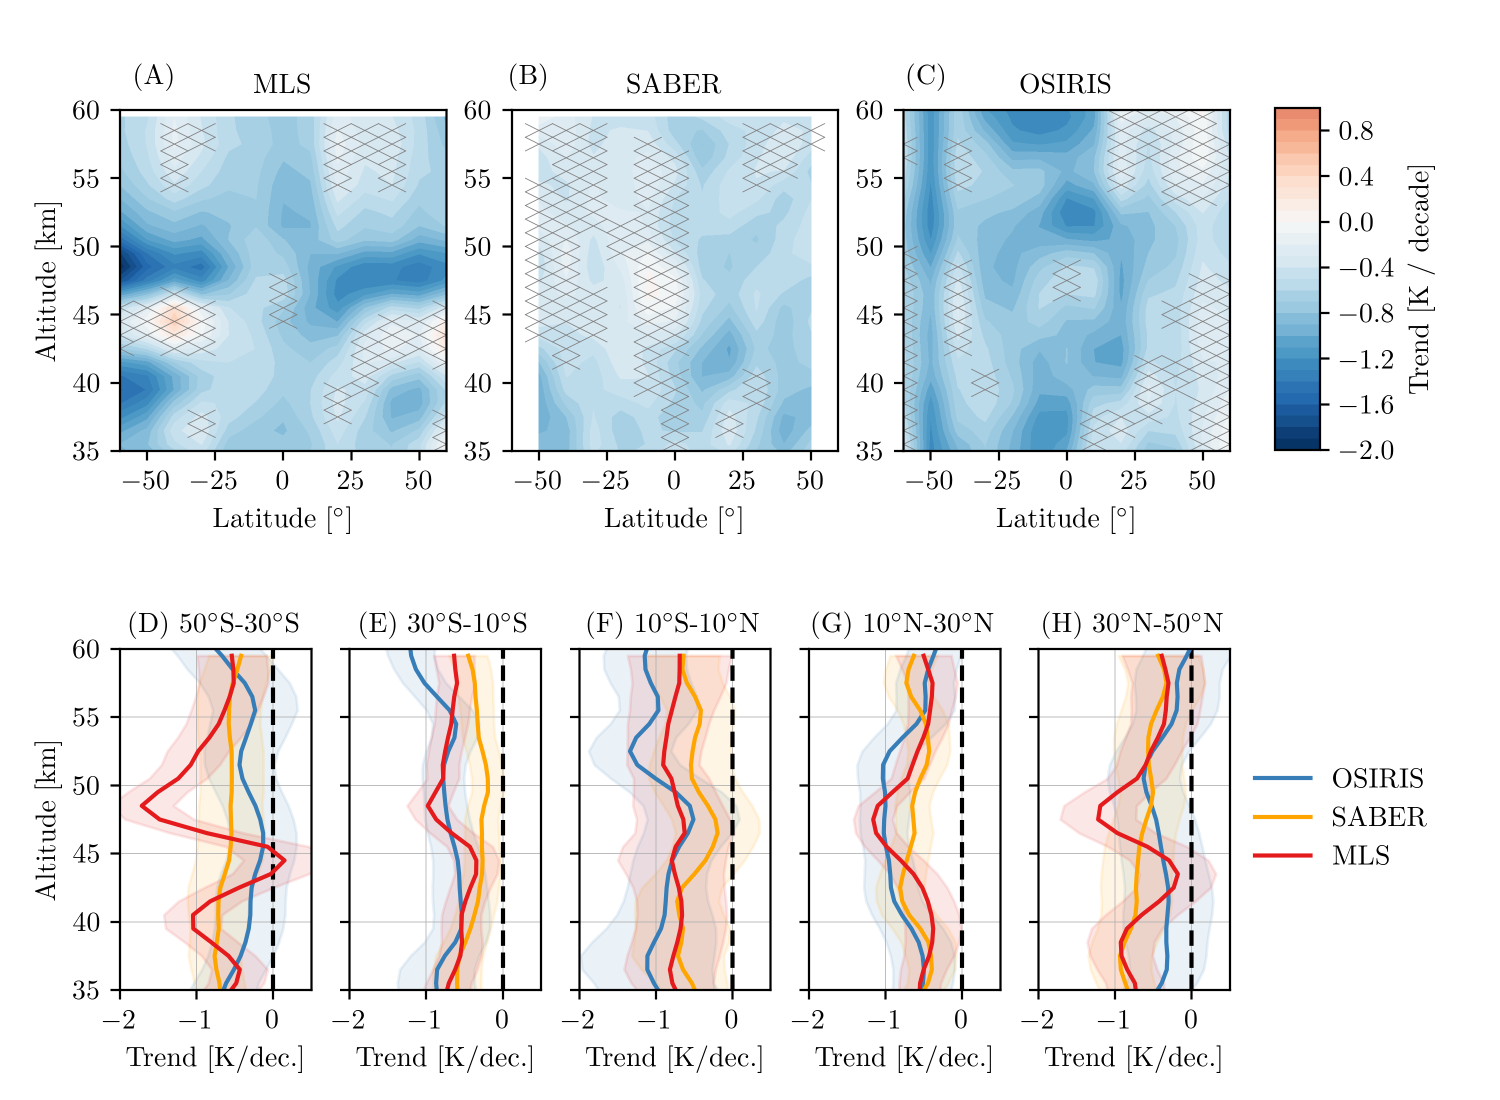
Temperature trends in the upper stratosphere, particularly above ∼ 45 km, are difficult to quantify due to a lack of observational data with high vertical resolution in this region that span multiple decades. The recent v7.3 upper-stratospheric (35–60 km) temperature data product from the Optical Spectrograph and InfraRed Imager System (OSIRIS) includes over 22 years of observations that can be used to estimate temperature trends. The trends in OSIRIS temperatures over 2005–2021 are compared to those from two other satellite limb instruments: Sounding of the Atmosphere using Broadband Emission Radiometry (SABER) and Microwave Limb Sounder (MLS). We find that the upper stratosphere cooled by ∼ 0.5 to 1 K per decade during this period. Results from the three instruments are generally in agreement. By merging the OSIRIS observations with those from channel 3 of the Stratospheric Sounding Unit (SSU), we find that the stratosphere cooled at a rate of approximately −0.6 K per decade between 1979 and 2021 near 45 km, in agreement with earlier results based on SSU and MLS. The similarity between OSIRIS temperature trends and those from other records improves confidence in observed upper-stratospheric temperature changes over the last several decades.
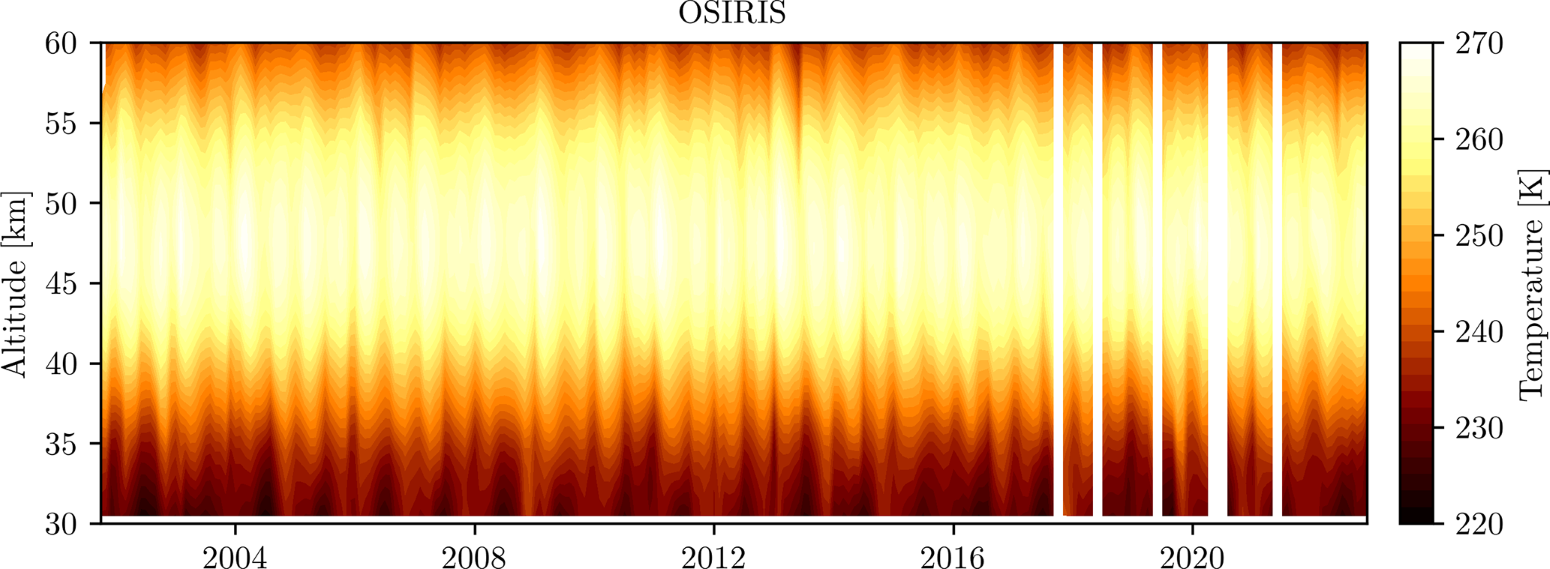
OSIRIS temperature data products spans over 22 years
A new upper stratospheric (35–60 km) temperature data product has been produced using OSIRIS limb-scattered spectra that now spans over 22 years. Temperature is calculated by first estimating the Rayleigh scattering signal and then integrating hydrostatic balance combined with the ideal gas law. Uncertainties are estimated to be 1–5 K, with a vertical resolution of 3–4 km. Correlative comparisons with the Atmospheric Chemistry Experiment Fourier Transform Spectrometer (ACE-FTS) and the Microwave Limb Sounder on Aura (MLS) are consistent with these uncertainty estimates and generally have no regions of statistically significant drift. The temperature data product is publicly distributed as part of the recently released OSIRIS v7.3 data products. An example of the produced data is shown in Figure 1. The technique differs from previous techniques in that multiple scattering is included rigorously in the forward model, with a novel method to estimate the amount of upwelling radiation.