
Extension Materials
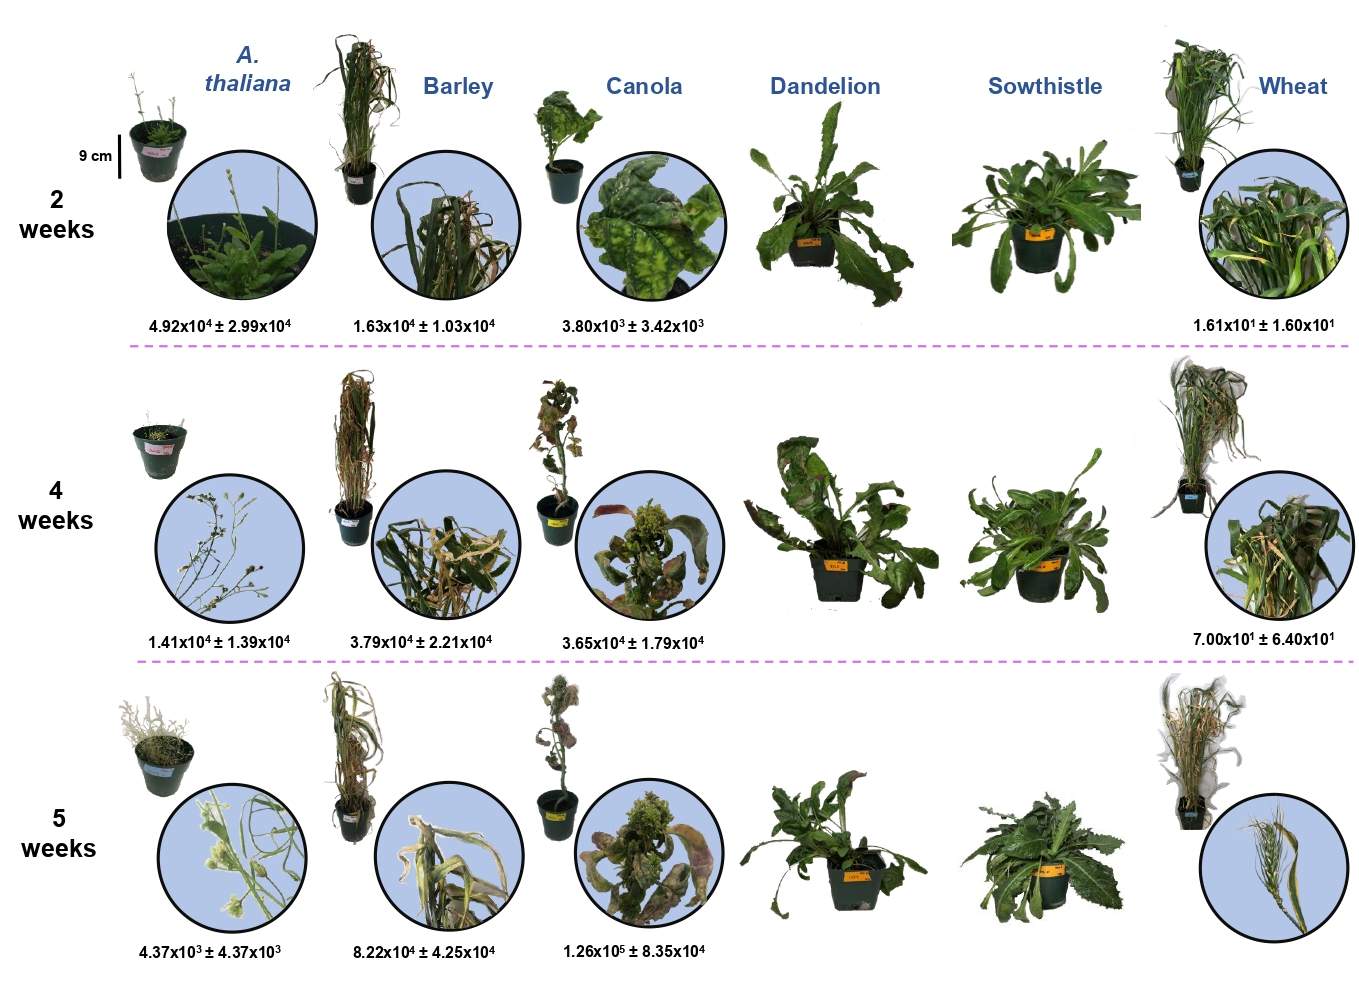
Figure 2: Examples of symptom expression in all plant species under study during each observation period (2, 4, and 5 weeks following exposure to AY-infected aster leafhoppers). Close-ups of symptoms have been provided for Arabidopsis thaliana, barley (CDC Copeland), canola (AC Excel), and wheat (AAC Brandon). The average number of copies of cpn60 per ng of genomic DNA has been indicated for each plant species and observation period. Details about the number of infected plants and host suitability can be found in Table 1 in the corresponding article (find it below).
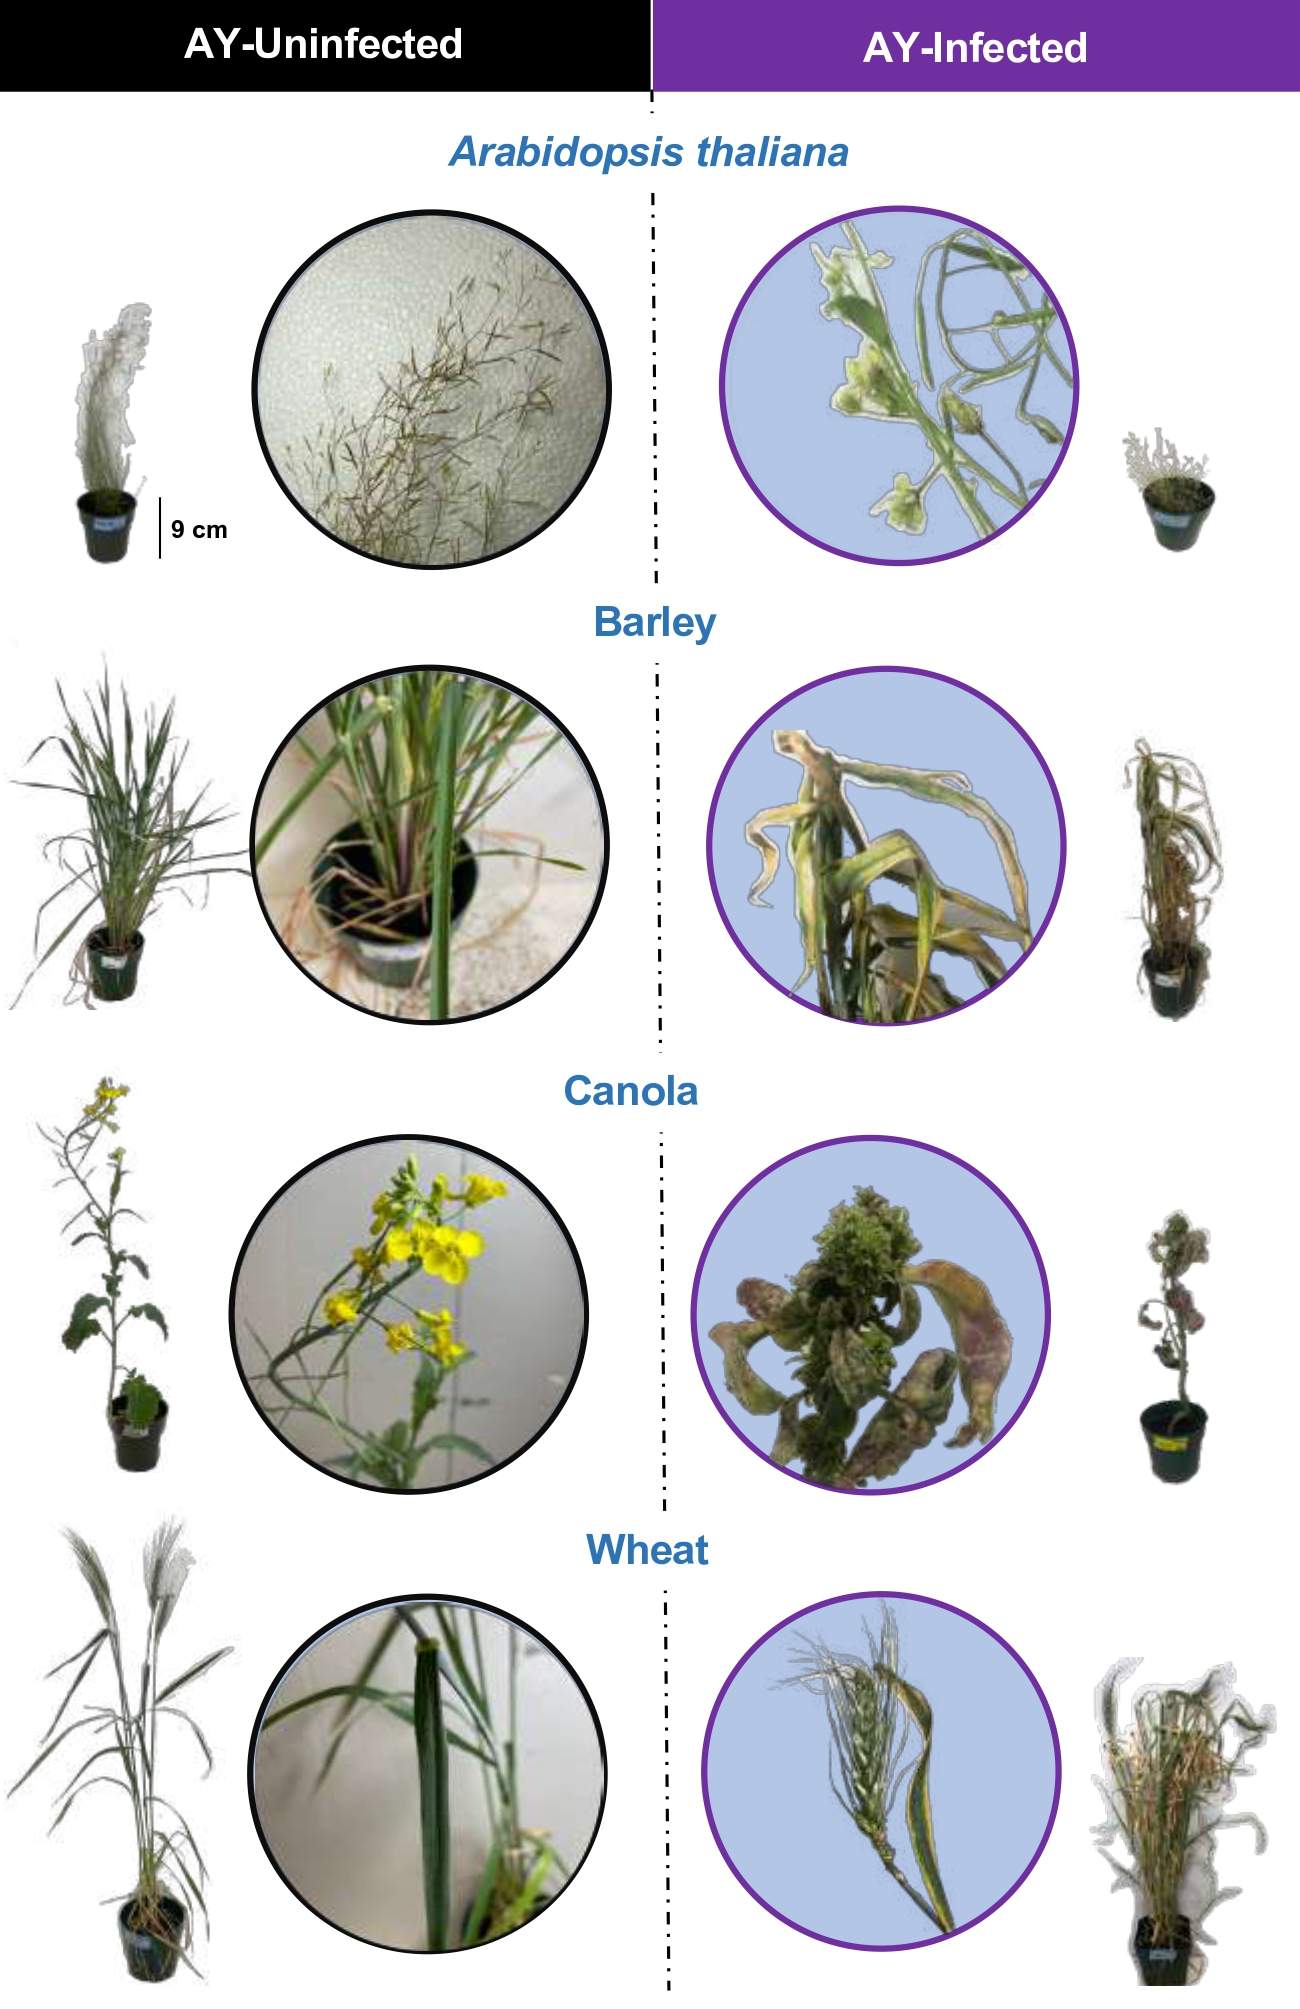
Figure 3: Symptom expression in Arabidopsis thaliana, barley (CDC Copeland), canola (AC Excel), and wheat (AAC Brandon) at 5 weeks following exposure to phytoplasma-infected aster leafhoppers. Examples of control plants (phytoplasma-Uninfected) have been placed next to symptomatic plants for comparison.
Link to paper (First Look version)
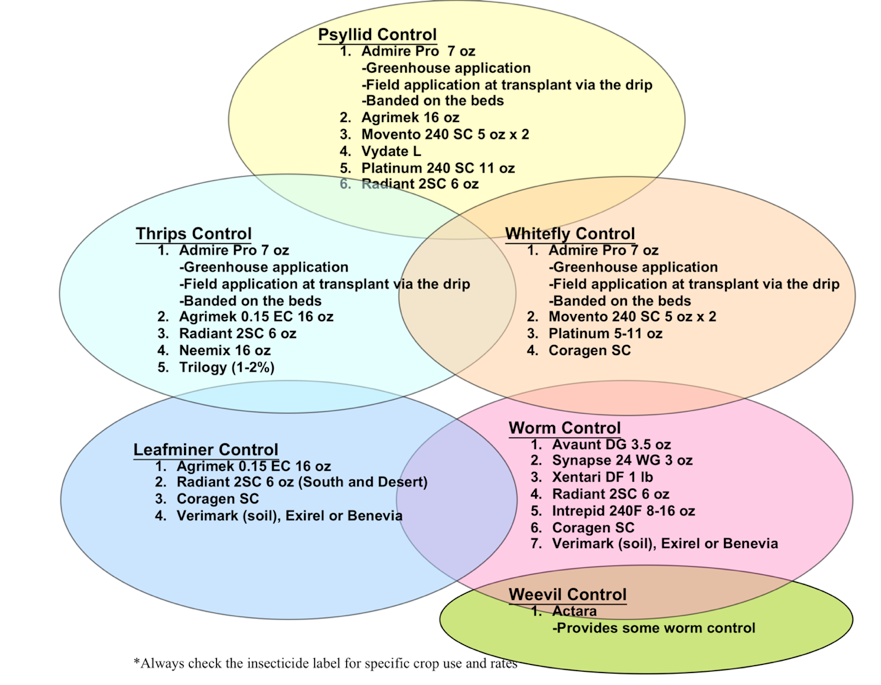
A low-input IPM program for controlling potato psyllid in California bell peppers, tomatoes and potatoes includes selecting pesticides to match the pest population present and using materials with the least detrimental effects on beneficial insects. Each circle indicates an optimized IPM rotation for that particular pest. Numbers indicate order of application within the rotational strategy and do not imply efficacy (higher number ≠ greater efficacy). When circles overlap, the rotation is expected to be effective against both pests. When a material appears in multiple circles, it can be expected to function for control against both (all) pests. When there is no material in common between two circles, it may be necessary to make an additional application using a material from each of the pests’ circles (rotation). Always check the insecticide label for specific crop use and rates.
Under Construction